Python · Streamlit · Quantitative Finance
Portfolio Analyzer
Quantitative Equity & Risk Management Dashboard for the Indonesian Market
Executive Summary
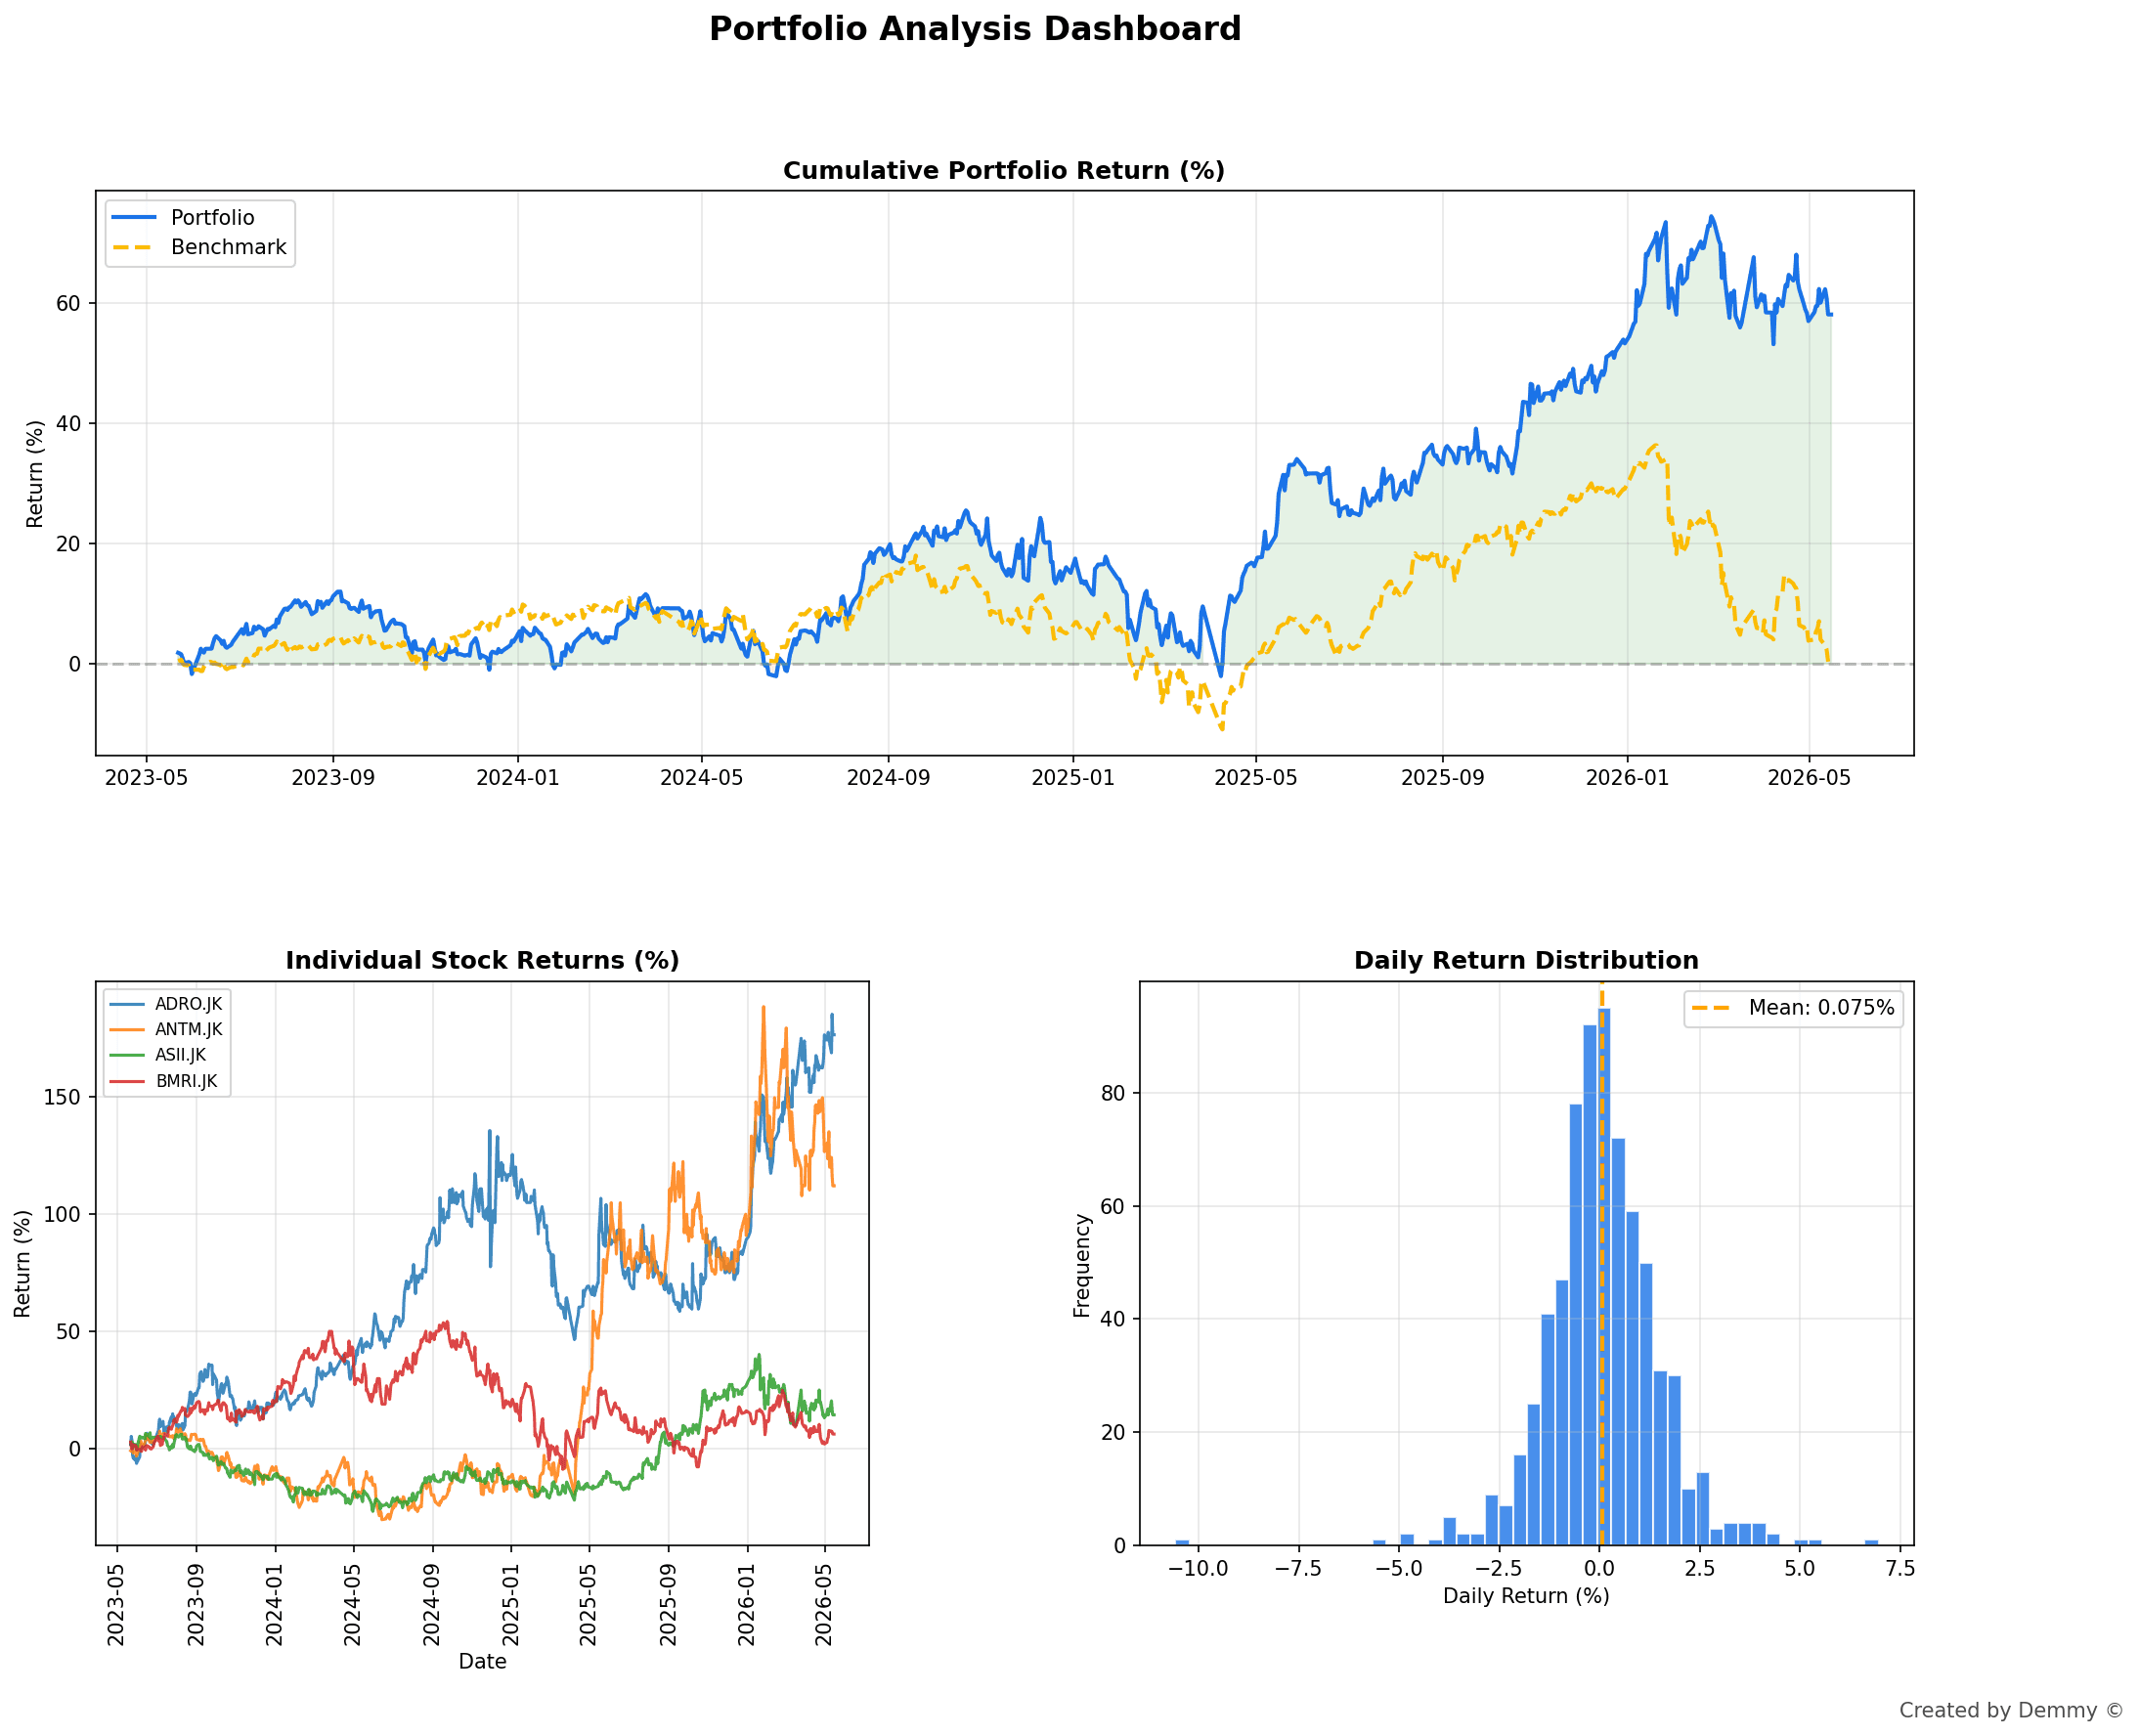
Portfolio Analyzer is a comprehensive analytics dashboard designed to evaluate, simulate, and optimise equity portfolios — with a focus on the Indonesian market (BMRI, ADRO, ANTM, ASII). Built with Python and Streamlit, it integrates advanced quantitative modelling with an interactive, data-driven interface.
The system demonstrates the fusion of financial analysis expertise and software engineering, translating raw market data into actionable investment insights through a single, unified platform.
Key Features
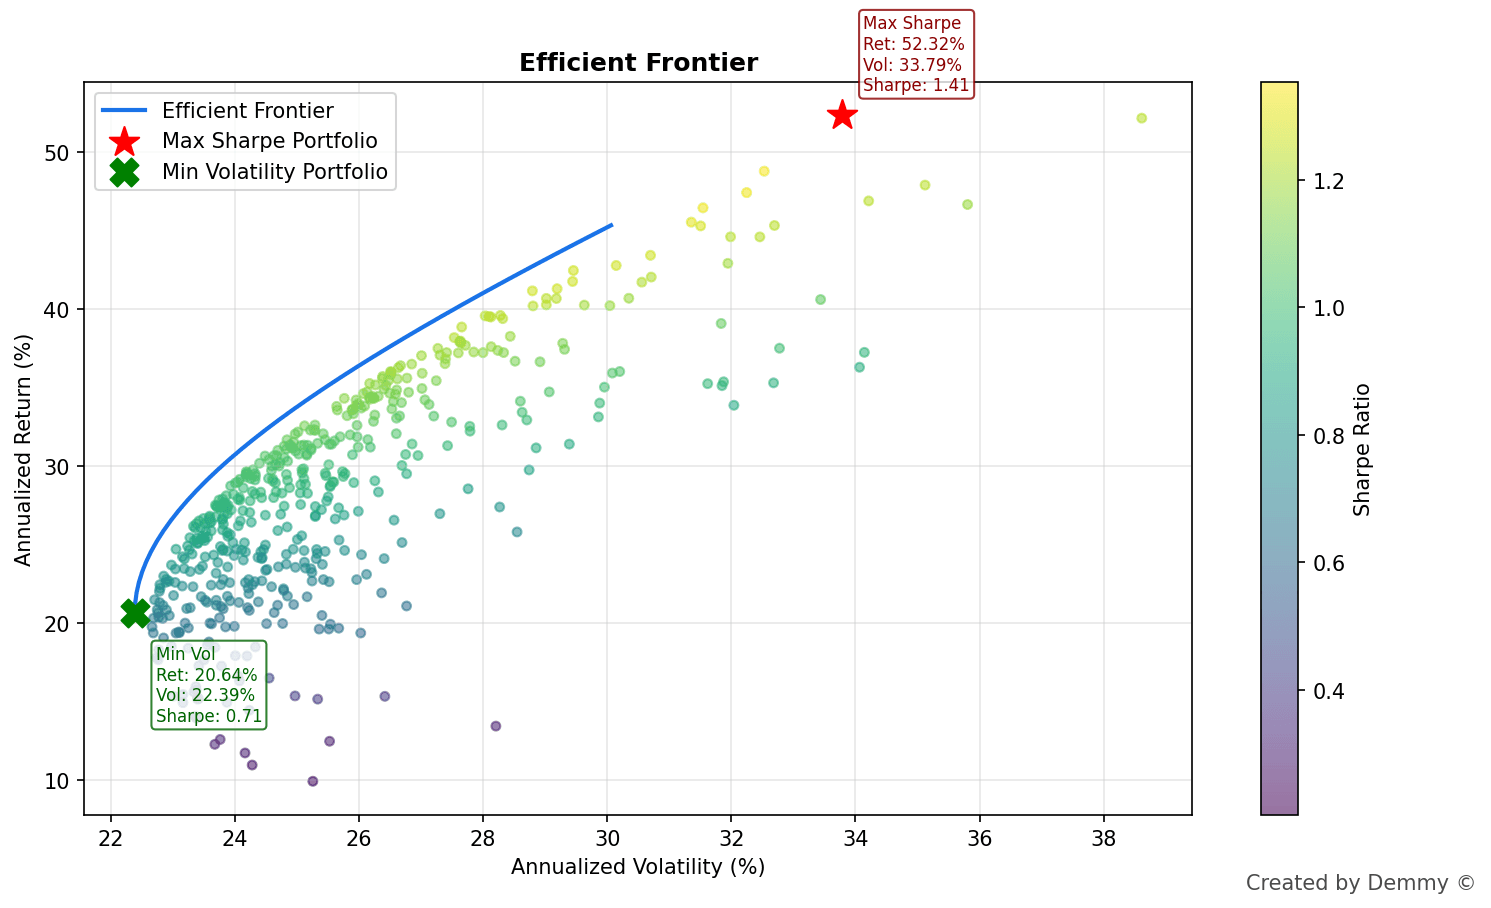
Portfolio Optimisation
Applies Modern Portfolio Theory (MPT) to optimise asset weights. Plots the full Efficient Frontier and identifies the Maximum Sharpe Ratio and Minimum Volatility portfolios via Monte Carlo sampling.
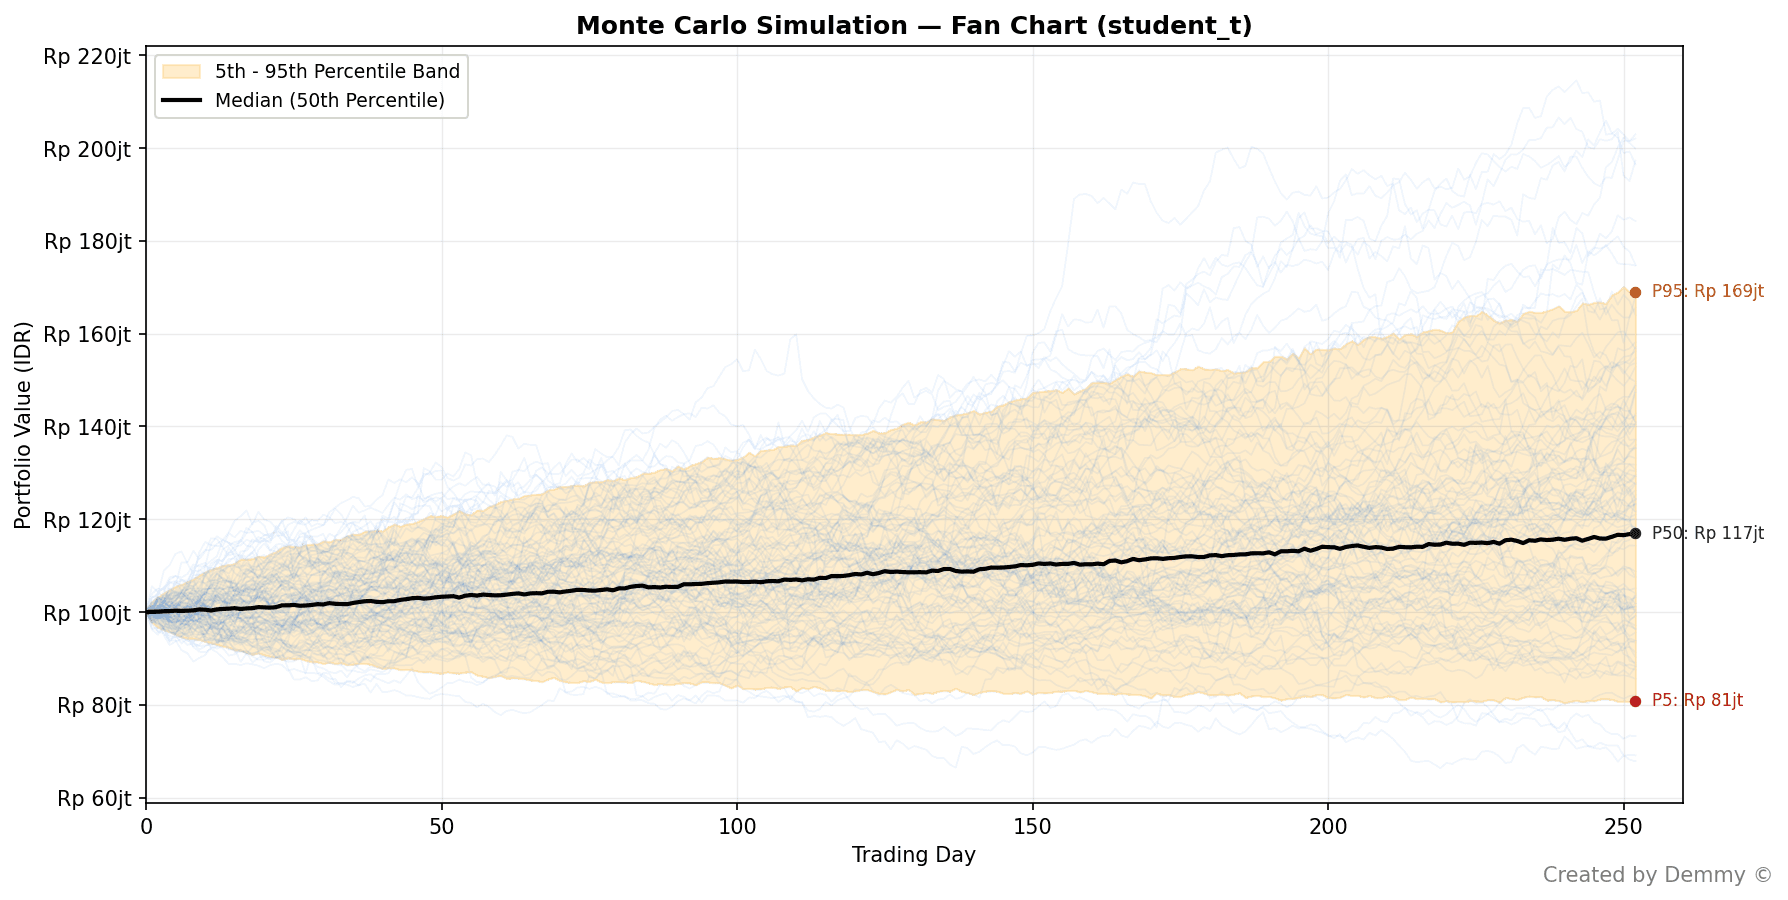
Monte Carlo Simulation
Projects thousands of price scenarios using a Student-t distribution to capture fat-tailed risk. Computes Value at Risk (VaR) and Conditional VaR (CVaR) at configurable confidence levels.
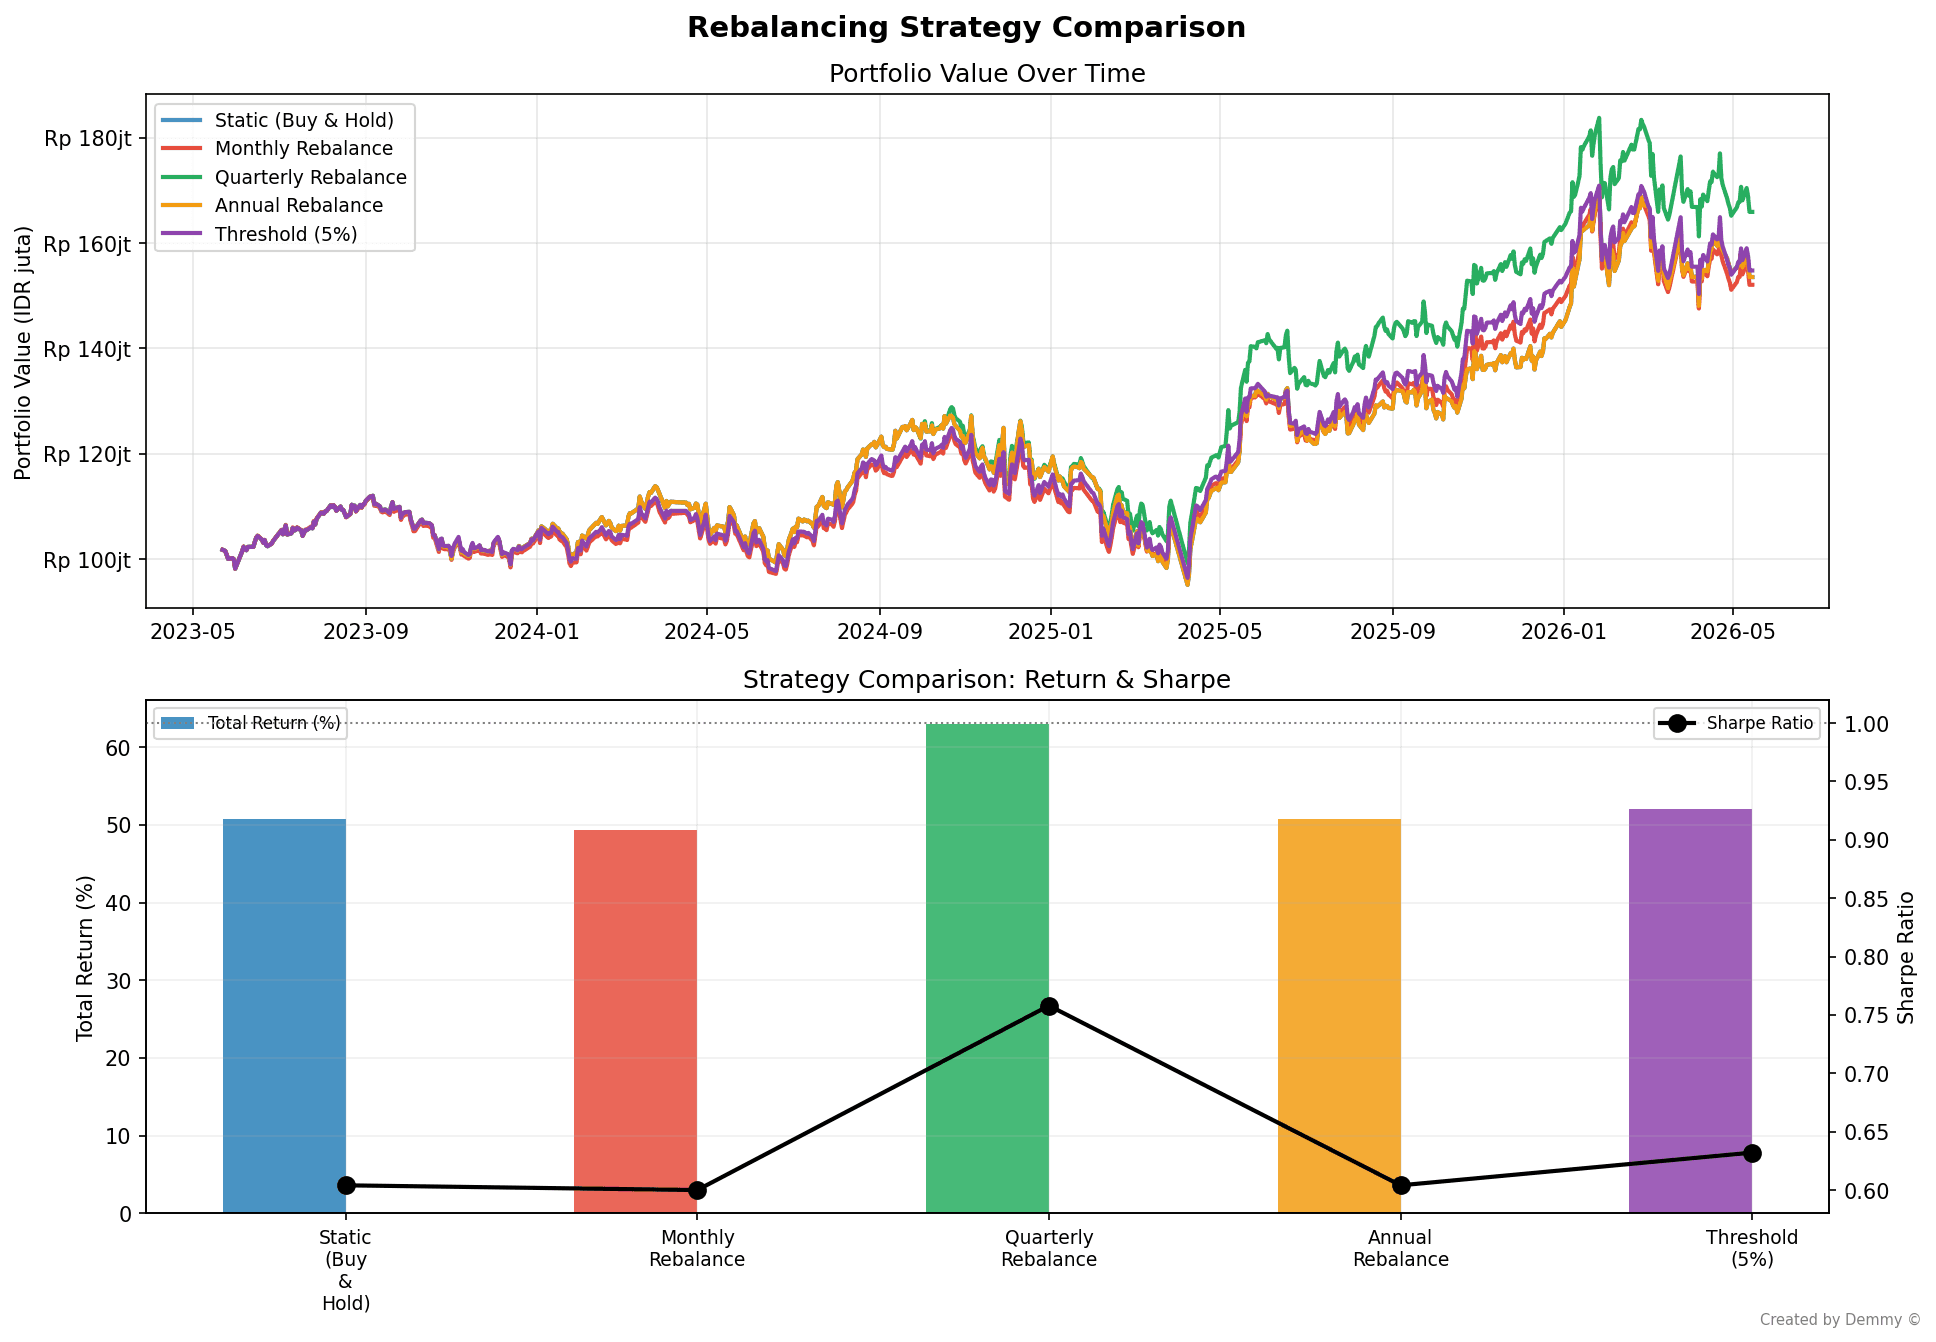
Strategy Backtesting
Compares Static Buy & Hold against periodic rebalancing strategies (Monthly, Quarterly, Annual, Threshold-based). Outputs total return, Sharpe Ratio, and portfolio value over time.
AI Analyst Integration
Embeds an AI layer that cross-checks quantitative metrics, generates plain-language insights, and flags anomalies — bridging the gap between raw numbers and interpretable analysis.
Technical Stack
Visual Showcase
Impact & Conclusion
This system demonstrates how complex investment decision-making can be distilled into data-driven insights. By combining rolling risk metrics (Maximum Drawdown, Sortino Ratio), multi-scenario simulation, and strategy comparison in one dashboard, Portfolio Analyzer empowers investors to move from intuition-based allocation to evidence-based portfolio construction — a meaningful step toward institutional-quality analysis for retail investors in Indonesia.